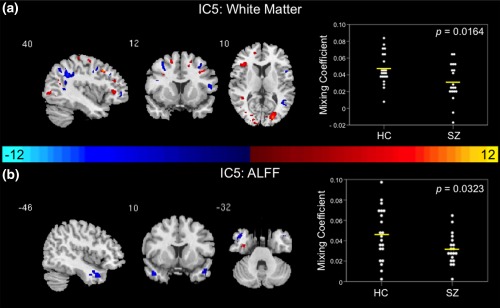
Figure 2.

Joint group‐differentiating IC5 in White Matter and ALFF. (a) WM and (b) ALFF ICs shown to significantly differentiate between controls and patients via parametric or nonparametric independent samples tests on mixing coefficients. Group differences are found in the two modalities among components with the same indices. Spatial maps are shown with a threshold of |Z| > 3.5. A list of the component regions can be found in Supporting Information, Tables II (WM IC5) and IV (ALFF IC5). Higher mixing coefficients in controls means WM and ALFF IC5 are expressed more in controls. When WM and ALFF IC5 z values are positive (red regions) and mixing coefficients are positive, the component is showing increased WM volume/ALFF in controls. Conversely, when WM and ALFF IC5 z values are negative (blue regions) and mixing coefficients are positive, the component is showing decreased WM volume/ALFF for controls. The opposite is true when mixing coefficients are negative. IC, independent component; HC, healthy control; SZ, schizophrenia patient; WM, white matter; ALFF, amplitude of low frequency fluctuations
