
Figure 7.
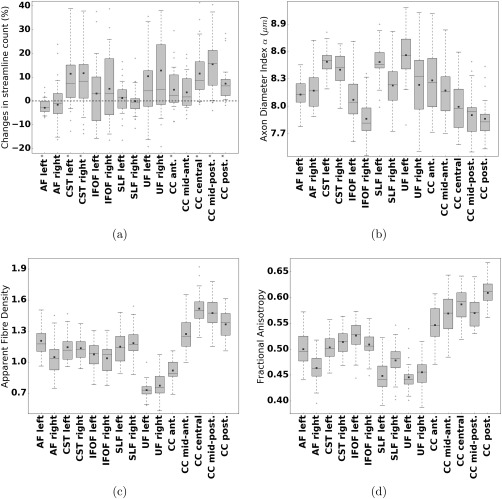
Fascicle property distributions of 34 healthy subjects. (a) Percentage change in the number of streamlines between AxTract and conventional deterministic tractography ( ). Fascicle with significant increase or decrease in streamline count are marked with an asterisk ( ). (b) The mean axon diameter index α, (c) the mean apparent fiber density, and (d) the mean fractional anisotropy, along streamline fascicles of 34 healthy subjects, obtained with AxTract. Results are shown for six fascicles: the arcuate fasciculus (AF), the CST, the IFOF, the SLF, the UF, and the CC. The CC is split in five sub‐fascicles using the FreeSurfer parcellation (anterior, mid‐anterior, central, mid‐posterior, posterior) and TractQuerier. Projection and association fascicles are reported for each hemisphere. The black line indicates the median, the square indicates the mean, the box extends from the first and third quartile and the whiskers are at the 5th and 95th percentile of the distribution.