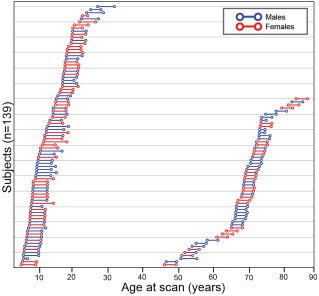
Figure 1.

Schematic diagram representing 139 subject ages at first and last scans for both neurodevelopmental (n = 84) and aging (n = 55) longitudinal cohorts. The younger cohort had ages‐at‐first scan of 5.6–27.1 years, while the older cohort had 46.1–83.3 years. Lines connecting the circles represent the interval (neurodevelopmental cohort: 4.1 ± 0.9 years; aging cohort: 3.1 ± 0.3) between scans for each individual subject. [Color figure can be viewed at http://wileyonlinelibrary.com]
