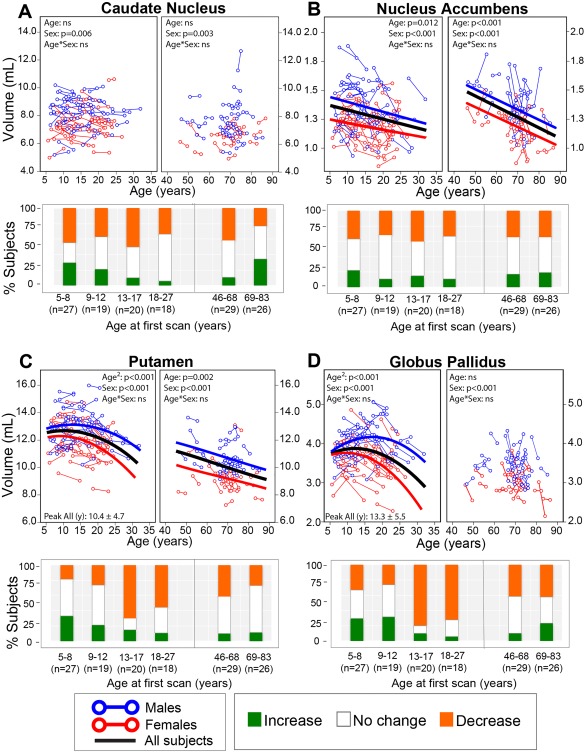
Figure 6.

Longitudinal trajectories of (A) caudate nucleus, (B) nucleus accumbens, (C) putamen, and (D) globus pallidus volumes with age with associated subject histograms denoting significant (greater than ±1 SD) volume changes between the two scans approximately 3–4 years apart on average. Panels with no best‐fit curves indicate non‐significant age effects in that cohort. The putamen and globus pallidus follow an inverted U‐shaped trajectory in the younger cohort, whereas putamen volume gradually declined in the aging cohort while globus pallidus volume did not change with age in the aging cohort. Nucleus accumbens volume decreased linearly with age over both groups. The caudate did not change significantly with age in either young or aging cohorts. The histograms show that the two youngest age bins show a mix of volume changes, but by age 13–17 years a large number of subjects are showing a reduction of volume between scans for the putamen and globus pallidus. In addition the two oldest age bins (after 46 years) show a mix with many showing no volume changes. [Color figure can be viewed at http://wileyonlinelibrary.com]
