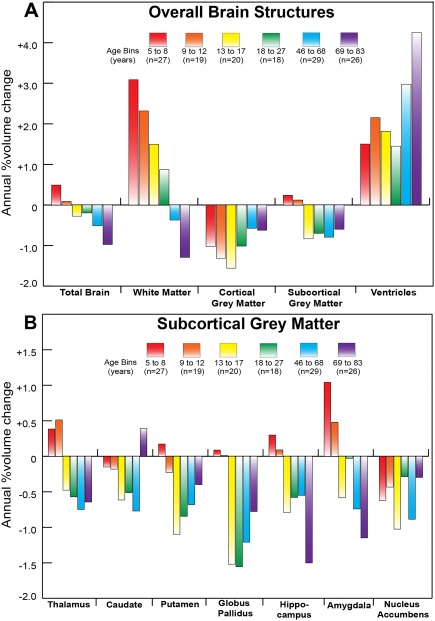
Figure 8.

Average annual percent volume change per age bin of (A) overall brain structures and (B) subcortical gray matter for the longitudinal neurodevelopmental and aging cohorts. This figure reveals the magnitude of annual volume change (in percent) experienced on average at each age bin as a complement to the histograms in Figures 5–7 which show the number of subjects experiencing significant changes in a brain structure between two scans separated by approximately 3–4 years on average. (A) The white matter increases lessen in magnitude with age and then reverse to decreases in older age. The cortical gray matter decreases at all ages and the subcortical gray matter only decreases above 13 years. The ventricle volume shows the greatest proportion of increase at the oldest age bin. (B) Structures that tend to peak later (thalamus and amygdala) experience positive and higher magnitudes of annual change in the two youngest age bins compared with structures of the basal ganglia. The reduction of subcortical gray matter volume is evident for all bins above 13 years. The largest percent annual reductions are in the 13–27 year range for globus pallidus and the 69–83 year range for hippocampus. [Color figure can be viewed at http://wileyonlinelibrary.com]
