
Figure 3.
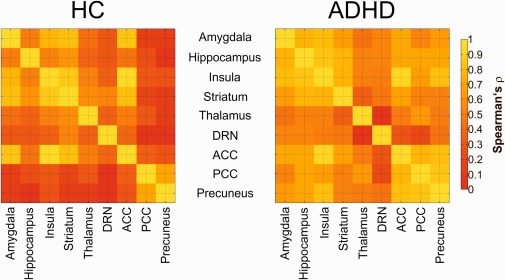
Molecular interregional molecular correlations of patients with ADHD and HC. Left map shows the correlation (Spearman's ρ) of SERT BPND in HC indicating interregional differences in functional coupling. Right map denote the condition in patients with ADHD. The color table represents the strength of interregional associations, red indicates lowest and yellow highest interregional associations. ADHD: attention deficit/hyperactivity disorder, SERT BPND: serotonin transporter binding potential, ROIs: regions of interest. HC: healthy controls. [Color figure can be viewed at http://wileyonlinelibrary.com]