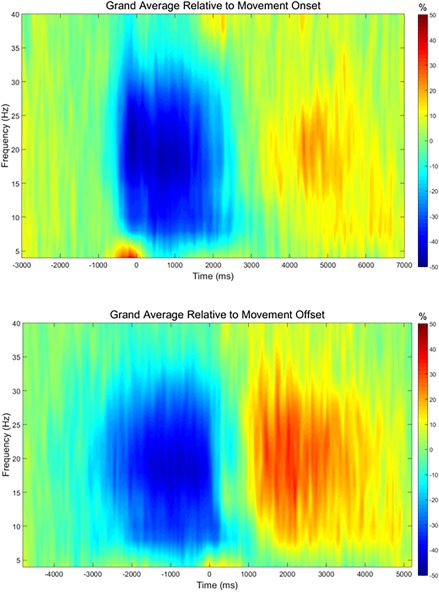
Figure 3.

Grand averaged time‐frequency plots of the peak sensor, which was located near the leg area of the sensorimotor strip. The same sensor was used in all participants for both the ERD and PMBR analyzes. The analysis was time‐locked to movement onset (top) to assess the beta ERD, and to movement offset (bottom) to assess the PMBR. For the beta ERD analysis (top), movement onset was defined as time 0.0 s and the baseline was defined as −1.6 to −1.2 s. A strong pre‐ and peri‐movement ERD (blue) can be seen from approximately −0.6 to 2.2 s. This response was strongest in the beta range, but also stretched into the alpha range. For the PMBR analysis (bottom), movement offset was defined as time 0.0 s and the baseline was defined as −4.6 to −4.2 s. A strong PMBR (red) could be seen from approximately 1.2 to 4.0 s. As with the ERD, the response was strongest in the beta range, but also stretched down into the alpha band. [Color figure can be viewed at http://wileyonlinelibrary.com]
