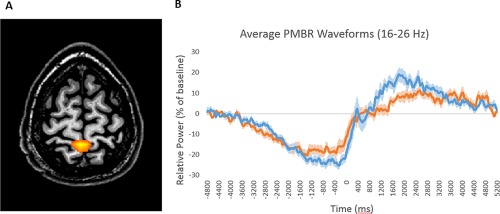
Figure 4.

(A) Grand averaged beamformer image of the post‐movement beta rebound (PMBR; 16–26 Hz, 1.9–2.3 s) from all participants indicated that the response was generated by the leg area of the pre/postcentral gyri. (B) Group averaged time series of the beta activity (16–26 Hz) extracted from the peak voxel. Time is shown on the x‐axis, with movement offset occurring at 0.0 s, while relative power (expressed as a percentage from baseline) is shown on the y‐axis. The PMBR was significantly stronger in healthy controls (blue line) relative to patients with MS (orange line) from 1.25 to 1.65 s. The shaded area around each line denotes the standard error of the mean (SEM). [Color figure can be viewed at http://wileyonlinelibrary.com]
