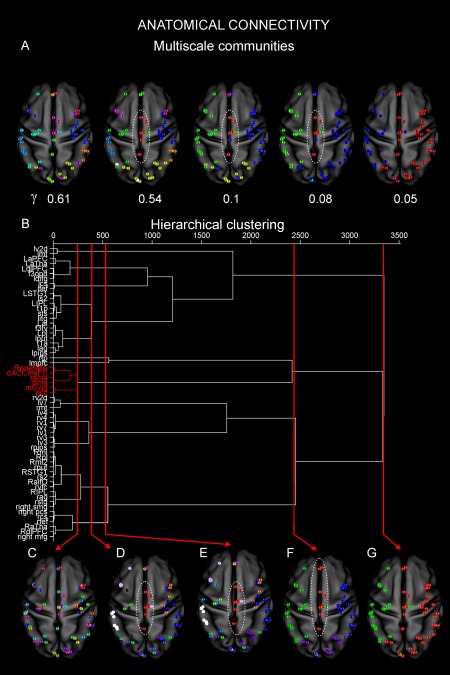
Figure 4.

Multiscale anatomical architecture. (A) The multiscale communities obtained by <DAC>. As in Figure 3, we sampled γ every 0.01 starting from 0 (not reported). In this case the progression of the communities indicates that from a scenario where the nodes are mixed across the considered networks (γ = 0.61), we soon observe (γ = 0.54) a strong backbone of interaction between pCC (DMN), SMA (SMN), mCing (FPN), dACCmsFC, and RpreSMA (CON) (red). At subsequent scales (γ = 0.1, 0.08), this backbone loses the node from the FPN but it is maintained (red) even when only three communities are identified in the brain. Interestingly these nodes remain more isolated from the rest of the brain until the final scale (γ = 0.05) when they are grouped into a larger community (red). (B) Hierarchical dendrogram. Functional hubs such as pCC and SMA are soon linked together (red) through other nodes from central networks such as FPN and CON. (C) At an initial hierarchical level, no complete RSNs could be retrieved, but only subnetworks. (D) By increasing the threshold, we observe a clustering in which nodes anatomically close to each are linked together. At this hierarchy, consistently to what observed before, a cluster comprising the same nodes as above from DMN, SMN, FPN, and CON emerges (red). (E) These nodes remain strongly connected and separated from the rest of the brain at the subsequent hierarchies. (F) An additional node from the DMN, namely, L/R mPFC joins this anatomical backbone (red). Notably, at this level, many other nodes even anatomically farther apart than these nodes are linked together. (G) Eventually, these nodes are linked to a larger community (red). Nodes belonging to important central networks are first anatomically linked to each other and only at the highest threshold are finally clustered together with the rest of the brain. [Color figure can be viewed at http://wileyonlinelibrary.com]
