Figure 3.

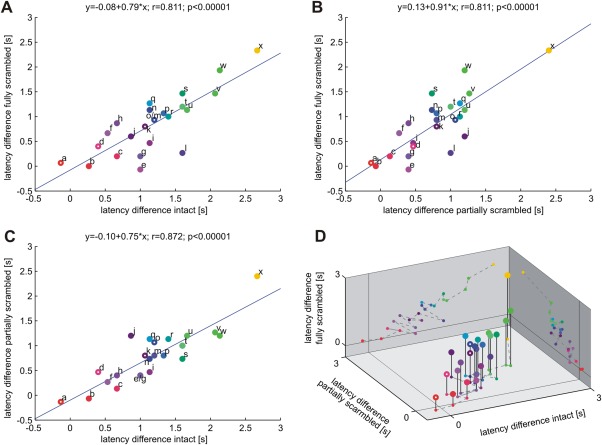
Regression analysis on peak BOLD latency differences between immediate and delayed response conditions across decision difficulty levels. High correlation coefficients suggest similar and stable sensory‐to‐motor gradients across ROIs during easy (intact patterns), medium (partially scrambled patterns) and difficult (fully scrambled patterns) tactile pattern decisions. Unfilled circles denote those decision candidate areas revealed in the delayed response condition. Area labels and color codes correspond to those defined in Figure 2 (a: PCS'_R, b: PCS_R, c: PCS_L, d: IPS'_R, e: SPL_R, f: aIPS_R, g: vPM_R, h: preSMA_L, i: aIPS_L, j: aINS_R, k: aINS'_R, l: mIPS_L, m: vPM_L, n: aINS_L, o: aINS'_L, p: ℓIPS_L, q: ACC_L, r: ℓIPS_R, s: SMA_R, t: SMA_L, u: dPM_L, v: SPL_L, w: ACC_R, x: VC_R).
