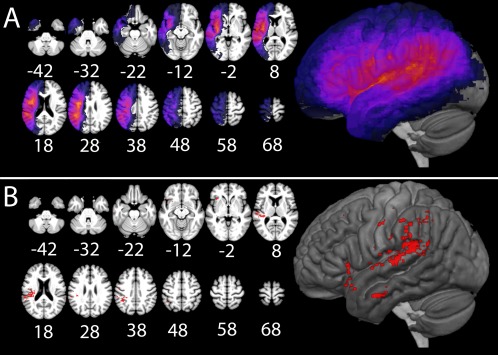
Figure 1.

(A) Lesion overlap map revealing where the greatest number of lesions occurred in our sample. (B) Results of the SVR‐LSM map showing the critical areas for naming, P < 0.005, in red. [Color figure can be viewed at http://wileyonlinelibrary.com]
