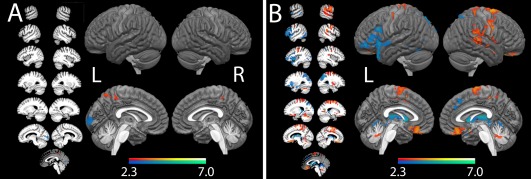
Figure 3.

Between‐group fMRI contrasts. (A) Covert naming and (B) overt naming. Red‐orange represents regions the aphasia group over‐activated relative to the control group, while blue represents regions the aphasia group under‐activated relative to controls. All results are shown at P < 0.05, cluster corrected. [Color figure can be viewed at http://wileyonlinelibrary.com]
