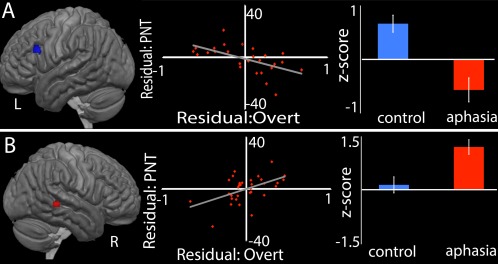
Figure 4.

Regions in which activity predicts naming ability, controlling for lesion size, PCAD, and other variables. Each section presents the ROI where activity significantly predicts naming performance, the residual plot showing predicted PNT against residual activation, and a bar graph showing raw activation for the control and aphasia groups. The ROIs where activity significantly predicted performance are (A) the left dPOp and (B) the right STS. [Color figure can be viewed at http://wileyonlinelibrary.com]
