
Figure 5.
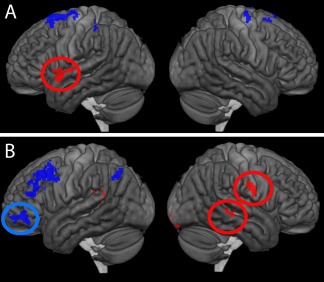
Regions of interest defined based on voxelwise bivariate correlations between activity and PNT during (A) covert naming and (B) overt naming. Red indicates a positive correlation, while blue indicates a negative correlation. Not shown is the right medial SMA ROI. Circles indicate ROIs were the relationship remained significant in a regression with all other factors were controlled. [Color figure can be viewed at http://wileyonlinelibrary.com]