
Figure 2.
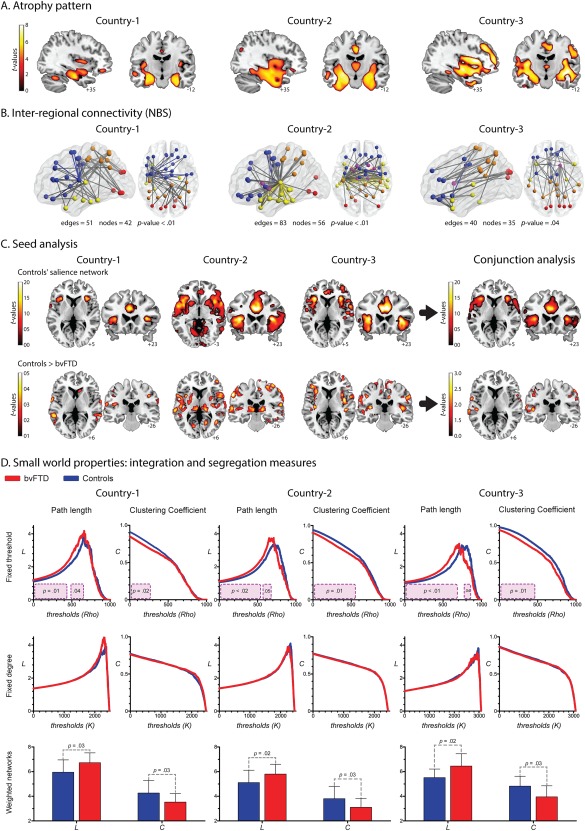
A. Atrophy pattern. VBM results (FWE‐corrected, P = 0.05, extent threshold = 100 voxels) showed a consistent pattern of atrophy in the three countries (Whitwell et al., 2009), involving the main areas reported for bvFTD patients: ACC, the insular cortex, orbitofrontal areas, and medial temporal regions (hippocampus and amygdala). B. Inter‐regional connectivity results. A single connected network, which involved different amounts of edges and nodes, was found altered in each country (P‐value <0.01, corrected). Node color coding: frontal areas, blue; parietal regions, orange; temporal areas, yellow; limbic system, purple; occipital regions, red. Edge color: gray indicates altered connections between different regions and color highlights connections within a region. C. Seed analysis. The connectivity maps of the control samples across centers showed a very consistent engagement of the insular cortex and the ACC, two main areas related to the SN (FWE‐corrected, P = 0.05, extent threshold = 50 voxels). Results from the comparison between controls and bvFTD are not consistent across countries (P = 0.001 uncorrected, extent threshold = 50 voxels). D. Graph results across countries: Integration and segregation measures. Fixed‐threshold (P < 0.05, cluster‐based corrected). Compared to controls, patients exhibited higher values of L. Country one: cluster one size from 0 rho to 0.41 rho; cluster two size from 0.48 rho to 0.62 rho; effect size 1.02. Country two: cluster one size from 0 rho to 0.5 rho; cluster two size from 0.60 rho to 0.66 rho; effect size 0.77. Country three: cluster one size from 0 rho to 0.66 rho; cluster two size from 0.76 rho to 0.83 rho; effect size 1.09. Regarding C, patients presented decreased values. Country one: cluster size from 0 rho to 0.26 rho; effect size 0.85. Country two: cluster size from 0 rho to 0.52 rho; effect size 0.75. Country three: cluster size from 0 rho to 0.45 rho; effect size 0.85. Fixed‐degree (P < 0.05, cluster‐based corrected). No differences were found in any of the countries. Weighted undirected matrices (P < 0.05). Patients exhibited higher values of L than controls. Country one: effect size 0.82. Country two: effect size 0.75. Country three: effect size 1.03. C was lower in patients than controls. Country one: effect size 0.80. Country two: effect size 0.73. Country three: effect size 0.94. [Color figure can be viewed at http://wileyonlinelibrary.com]