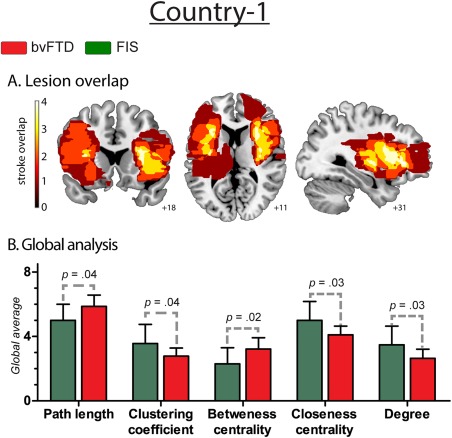
Figure 4.

Results regarding fronto‐insular stroke patients. A. Lesion overlap. Frontal and insular structures that were injured in stroke patients. The colormap indicates lesions overlapping across the group: dark red refers to areas affected by the lesion of only one subject, while white shows injured areas shared by four patients. B. Global analysis. Effect size of global measures. L: 0.85; C: 0.85; BC: 0.93; CC: 0.95, and K: 0.93. [Color figure can be viewed at http://wileyonlinelibrary.com]
