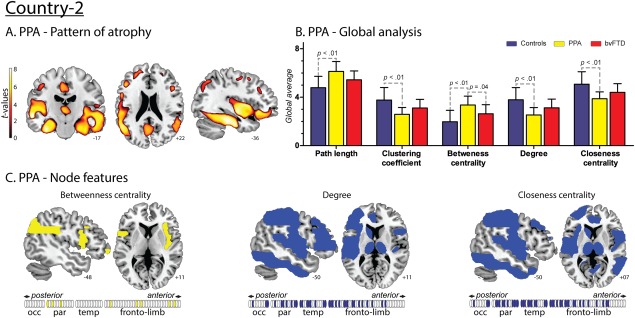
Figure 5.

Results regarding PPA patients from Country‐2. A. Atrophy pattern. VBM results showed a fronto‐temporal pattern of atrophy with left‐side predominance. B. Global analysis. Effect sizes of the significant differences between PPA and controls. L: 1.46; CC: 1.42; BC: 1.58; CC: 1.46 and K: 1.49. Effect sizes of the significant differences between PPA and bvFTD. BC: 0.92. C. Nodal centrality features. Compared to controls, PPA patients presented decreased values of K and CC in a distributed manner affecting parietal, temporal and fronto‐limbic areas, and an increased value of BC in parietal and fronto‐limbic areas. [Color figure can be viewed at http://wileyonlinelibrary.com]
