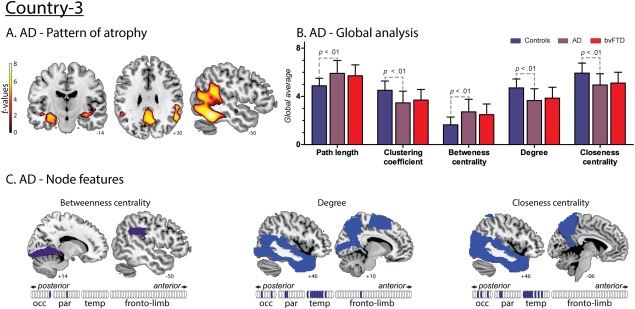
Figure 6.

Results regarding AD patients from Country‐3. A. Atrophy pattern. VBM results presented atrophy mainly in the hippocampus and parahippocampus, precuneus, posterior cingulate cortex and posterior temporal regions. B. Global analysis. Effect sizes of the significant differences between AD and controls. L: 1.17; C: 1.15; BC: 1.22; CC: 1.08 and K: 1.18. No differences were found between AD and bvFTD. C. Nodal centrality features. Compared to controls, AD patients presented decreased values of K and CC in temporal, parietal and occipital regions and an increased value of BC in parietal and occipital areas. [Color figure can be viewed at http://wileyonlinelibrary.com]
