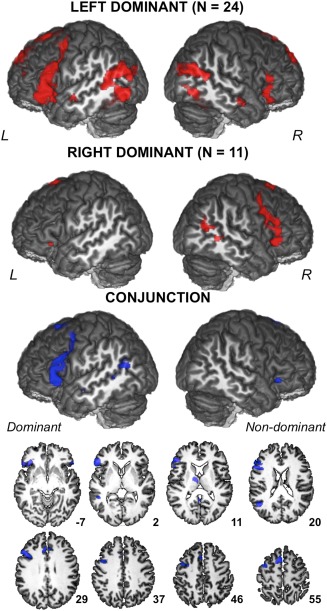
Figure 6.

Three‐dimensional rendering of the statistical parametric maps of sentence production minus the recitation of a list of words activations in the left‐dominant and right‐dominant SVM groups. The conjunction analysis between BOLD left‐dominant group and flipped BOLD right‐dominant group revealed the brain regions that are conjointly activated in the dominant hemisphere and the non‐dominant hemisphere of each group. Displayed results are significant at P < 0.05 with family‐wise error (FWE) rate correction for multiple comparisons (R right; L left), and superimposed onto an anatomical MRI image surface of one individual that served to define the 80‐TVS template of the BIL&GIN. [Color figure can be viewed at http://wileyonlinelibrary.com]
