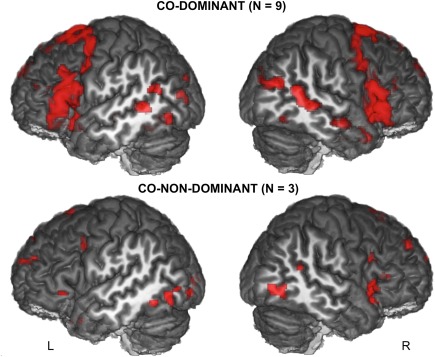
Figure 7.

Three‐dimensional rendering of the statistical parametric maps of sentence production minus the recitation of a list of words activations in the co‐dominant and co‐non‐dominant SVM groups. Results are displayed at P < 0.001 uncorrected for multiple comparisons and superimposed onto an anatomical MRI image surface of one individual that served to define the 80‐TVS template of the BIL&GIN (L: left; R: right). [Color figure can be viewed at http://wileyonlinelibrary.com]
