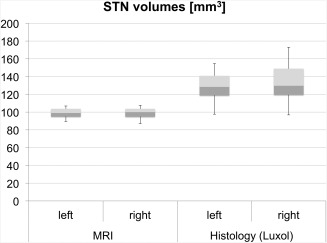
Figure 4.

Volumes of the subthalamic nucleus (STN) in magnetic resonance imaging (MRI) and histology. Volumes calculated from histology appear to be higher than those gained from MRI. The boxplots show the 25th percentile, median and the 75th percentile. The error bars reflect the minima and maxima.
