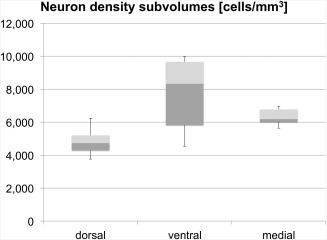
Figure 6.

Neuron densities in predefined subvolumes within the human subthalamic nucleus (STN). Densities calculated in the dorsal subregion of the STN were significantly lower than those in the ventral part. The boxplots show the 25th percentile, median and the 75th percentile. The error bars reflect the minima and maxima.
