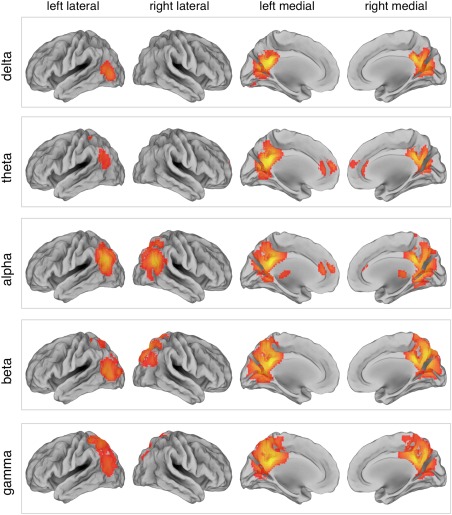
Figure 3.

DMN maps obtained by tICA for different frequency bands. The DMN was reconstructed using power envelopes in the delta (1–4 Hz), theta (4–8 Hz), alpha (8–13 Hz), beta (13–30 Hz), and gamma (30–80 Hz) bands, respectively. Surface maps are presented in left/right lateral and medial view (N = 19, threshold P < 0.01 TFCE‐corrected). [Color figure can be viewed at http://wileyonlinelibrary.com]
