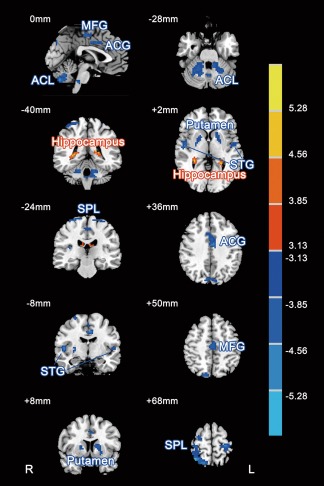
Figure 3.

Paired comparisons of regional ReHo before and after chronic high‐altitude exposure (|t|> 2.70, P < 0.01, AlphaSim corrected). Compared with those pre‐exposure, the red areas indicated higher ReHo and blue areas indicated lower ReHo in the subjects after exposure. The slice location is marked in the upper‐left corner in each image. The color bar on the right indicates the T values. ACL, anterior cerebellum lobule; STG, superior temporal gyrus; SPL, superior parietal lobule; ACG, anterior cingulate gyrus; MFG, middle frontal gyrus. L, left; R, right.
