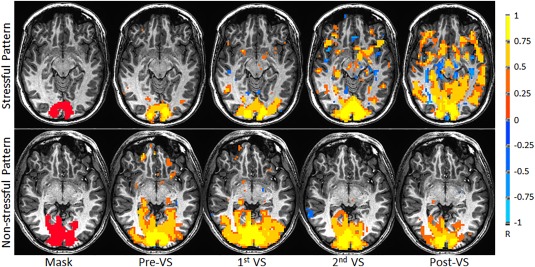
Figure 2.

Illustration of visual stimulation‐enhanced functional connectivity in visual cortex for one representative subject (R = 0.3315, P = 1.0 × 10⁻⁸). From left to right: the overlapped ROI mask in the visual cortex, the baseline FC map prior to the visual stimulation (Pre‐VS), the first FC map during the first half of the 25‐min stimulation (first VS), the second FC map during the second half of the stimulation (second VS), and finally the FC map after the stimulation (Post‐VS).
