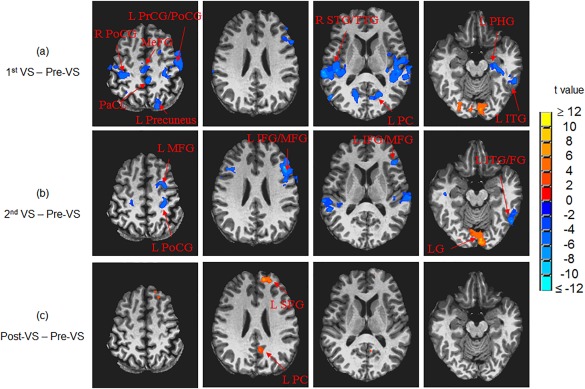
Figure 4.

Whole‐brain ANOVAs showed significantly modified functional connectivity between V1 and other brain regions (comparing to the baseline prior to the visual stimulation): (A) during the first half of the 25‐min stressful visual stimulation, (B) during the second half of the 25‐min stressful visual stimulation, and (C) right after the stressful visual stimulation. R: right; L: left; PrCG: precentral gyrus; PoCG: postcentral gyrus; PaCL: paracentral lobule; IFG: inferior frontal gyrus; MFG: middle frontal gyrus; SFG: superior frontal gyrus; MeFG: medial frontal gyrus; ITG: inferior temporal gyrus; STG: superior temporal gyrus; TTG: transverse temporal gyrus; PC: posterior cingulate; LG: lingual gyrus; PHG: parahippocampal gyrus; FG: fusiform gyrus.
