
Figure 6.
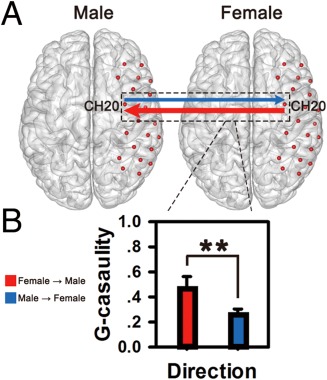
Directional coupling in lover dyads. (A) The G‐causality was analyzed on two directions (from males to females, from females to males). Significant G‐causality was indicated by the solid‐lines (thresholded at P < 0.001). (B) Mean G‐causalities in both directions were illustrated in the bar graphs. The mean causality from females to males (indicated by red color) was significantly higher than that from male to female (indicated by blue color). **P < 0.01. Error bars represent standard errors. [Color figure can be viewed at http://wileyonlinelibrary.com]