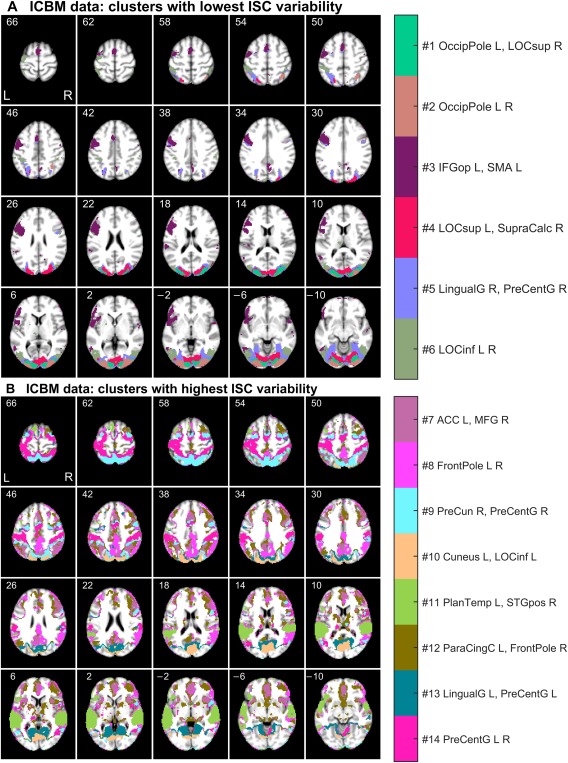
Figure 5.

Functional segmentation of the ICBM data: (A) clusters with lowest ISC variability, and (B) clusters with highest ISC variability relative to the mean. The axial slices are presented and labeled with millimeters in the MNI coordinates. For the abbreviations of the brain region names and the spatial coordinates of the cluster centers, see Supporting Information (Section 1, Tables S1 and S3). [Color figure can be viewed at http://wileyonlinelibrary.com]
