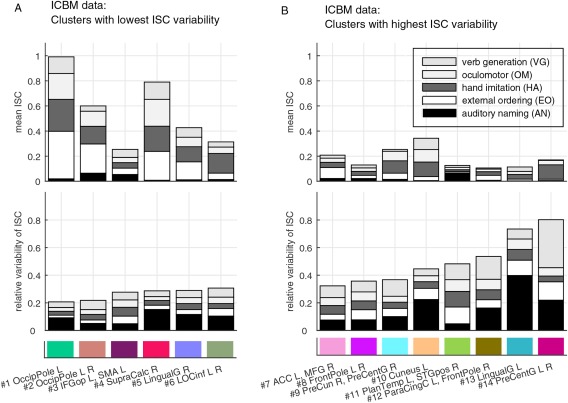
Figure 6.

“Building blocks” of the clusters found in the ICBM data: (A) ISC features of clusters with lowest variability, and (B) ISC features of clusters with highest variability. Note that the clusters are ordered according to the total (relative) variability across the tasks, meaning that the heights of the variability bars are in the increasing order. The feature values shown in the bars correspond to the distribution (mean) parameters of the GMM. The grayscale corresponds to tasks of interest, and the color code corresponds to clusters shown in Figure 5. See Table S1 in Supporting Information for the abbreviations of the brain region names. [Color figure can be viewed at http://wileyonlinelibrary.com]
