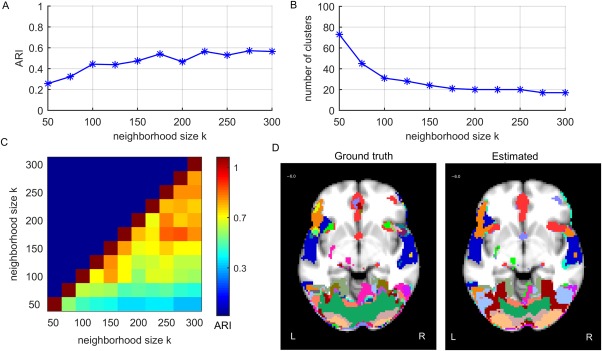
Figure 8.

Results of the FuSeISC for the simulated ICBM data: (A) clustering quality, (B) total number of clusters, (C) stability of the results, and (D) an example slice showing spatial organization of the clusters (both ground truth and estimated clusters are shown). [Color figure can be viewed at http://wileyonlinelibrary.com]
