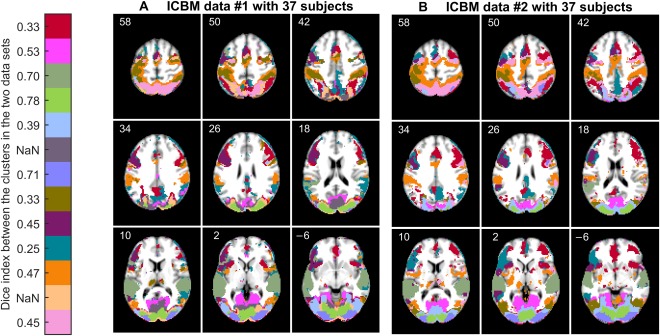
Figure 9.

Functional segmentation result (k = 250) of (A) ICBM data set with 37 subjects, and (B) ICBM data set with another 37 subjects. The cortical segmentation in the two data sets is relatively similar. Clusters in the two data sets are matched using the Munkres assignment algorithm. Similarity between the clusters according to the Dice index is shown next to the color bar, “NaN” meaning that the corresponding cluster is present only in the leftmost data set. Postprocessing was used to emphasize similarities and differences between the results in the cortical areas. The corresponding raw segmentation results are provided in Figure S9 (Section 8 in Supporting Information). [Color figure can be viewed at http://wileyonlinelibrary.com]
