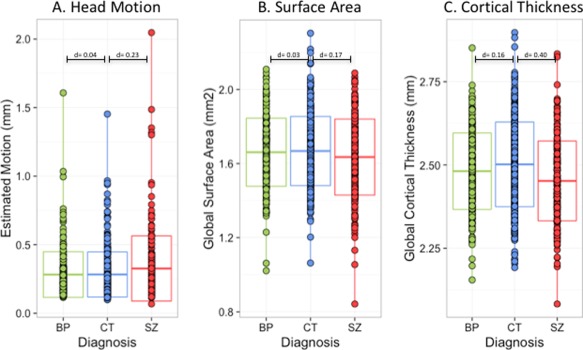
Figure 1.

Head Motion, Global Surface Area and Global Cortical Thickness Distributions by Diagnostic Group. Panel A depicts the distribution of head motion, estimated with a frame‐displacement technique during resting state functional MRI, to be used as a proxy for motion during structural scanning. Individuals with schizophrenia (n = 226) had higher levels of head movement when compared with either individuals with bipolar disorder (n = 227) or healthy volunteers (n = 370). Panel B shows the distribution of the average or global surface area across cortex for the three diagnostic groups. Panel C portrays the distribution of global cortical thickness across cortex for the three diagnostic groups. Individuals with schizophrenia had reduced surface area and cortical thickness compared with other groups. [Color figure can be viewed at http://wileyonlinelibrary.com]
