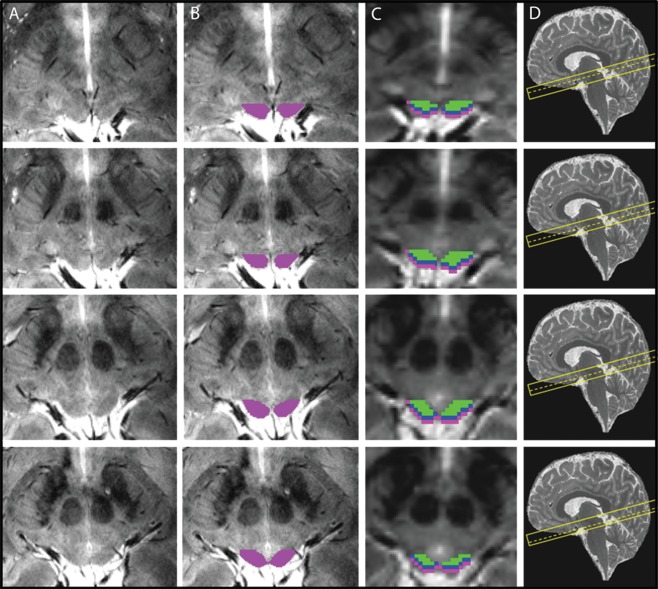
Figure 4.

Region‐of‐interest definitions in one participant across five slices. (A) Plain slices of the high resolution 2D FLASH sequence through the SC. (B) ROIs based on the boundaries described in Figure 1 and drawn on each slice overlaid on the high resolution anatomical scans. (C) zones of the SC overlaid on the functional EPI scan, after downsampling the ROIs to match the EPI voxel size. cyan: superficial zone, blue: intermediate zone, green: deep zone. D: slice localization of each image (dashed line) shown on a sagittal MP2RAGE image from the same subject. [Color figure can be viewed at http://wileyonlinelibrary.com.]
