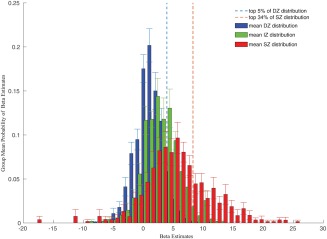
Figure 7.

Histograms of the group's mean beta value probabilities in the delineated depth ROIs. Error bars indicate standard deviations across participants. The dashed red line indicates the 66th percentile of the superficial probability density functions, i.e., 34% of the beta values were above this threshold. This threshold was chosen because of animal data and quantitative models that let us expect 34% of the superficial zone to be activated by the visual stimulation. The dashed line indicates the 95th percentile of the deep probability density function. [Color figure can be viewed at http://wileyonlinelibrary.com.]
