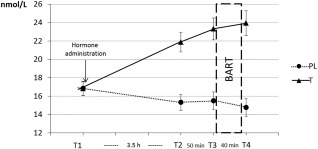
Figure 2.

Hormone levels are presented separately for the testosterone (T) and placebo (PL) group. Mean raw levels and standard errors are indicated. Testosterone levels were significantly higher after applying the testosterone gel in the testosterone group (see T2, T3 and T4). The BART was performed between T3 and T4.
