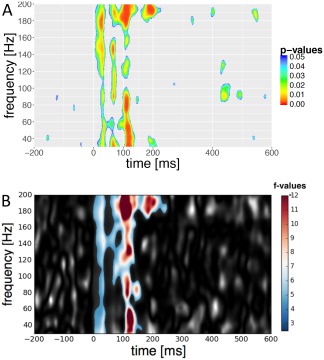
Figure 4.

Effect of loudness variation on total gamma‐band activity in the primary auditory cortex (A) Main effect from a linear mixed‐effect model analysis over all conditions (60–100 dB). P values are FDR corrected. (B) Contrast between 60 dB and 100 dB using a nonparametric 2‐sample permutation cluster test. F values are shown in grey for each frequency bin and time point. A single cluster (color coded) was found to be significant (P = 0.001, corrected for multiple comparisons) across subjects (n = 14) and over a time span of 250 ms (−2 to 248 ms). The duration of the significantly increased total GBR power indicates sustained GBR activity over a wide range of frequencies during the 100 dB intensity recordings with its maximum around 120 ms. [Color figure can be viewed at http://wileyonlinelibrary.com]
