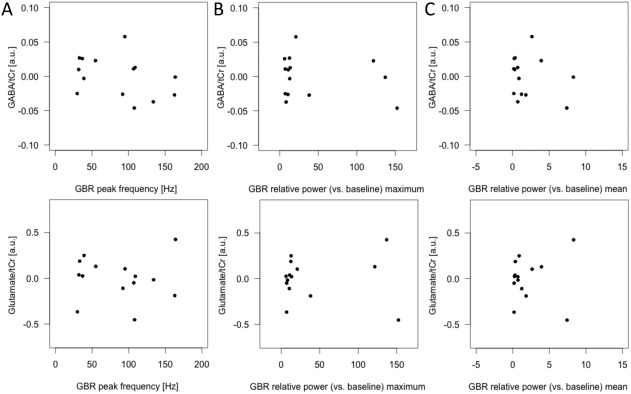
Figure 5.

Scatterplots showing the relationship between 1H‐MRS and total GBR measures in response to highest intensity (contrast 100 dB versus 60 dB). No correlations were observed between GABA and glutamate concentrations and GBR peak frequency (A), maximum of the relative GBR (z values) (B), and mean of the relative GBR (z values) based on individual data and across the time window of interest (−2 and 248 ms). tCr = total creatine; a.u. = arbitrary unit; n = 14.
