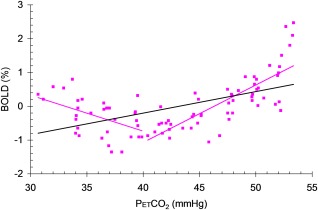
Figure 2.

An example illustrating the CVR and pattern type calculations. Purple filled square symbols = a single voxel BOLD response to PetCO2 fitted with a single black line (slope = CVR), and two purple lines whose slope signs were used to categorise the response pattern type (here, D = −/+).
