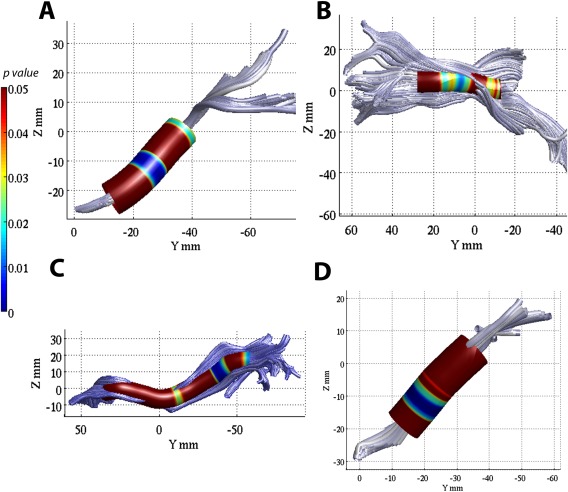
Figure 1.

AFQ tract profile analyses of FA showing significant group difference, with lower FA in mTBI group over the parahippocampal part of the left cingulum bundle (corrected P ≤ 0.05, FDR = 0.05) than non‐TBI controls (A); lower FA in high blast‐exposed group than low blast‐exposed over the left anterior thalamic radiation (FDR = 0.08) (B), and the left inferior fronto‐occipital fasciculus (FDR = 0.10) (C); lower FA over the right CAB (FDR = 0.08) in the high blast‐exposed mTBI with PTSD than the high blast‐exposed mTBI without PTSD (D).
