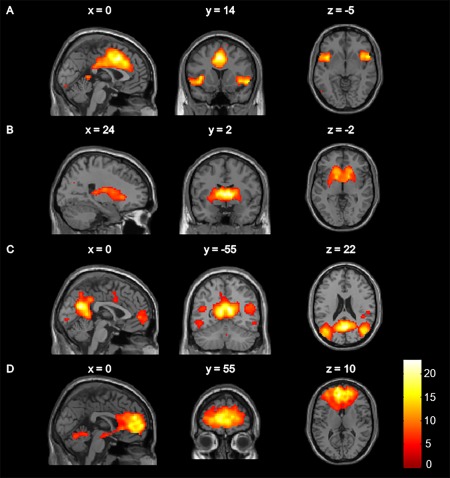
Figure 1.

Spatial maps of the resting state networks of interest: (A) salience network, (B) basal ganglia network, (C) default mode network, (D) anterior cingulate cortex–orbitofrontal cortex network. Colour bar represents t statistics. Maps were visualized using a threshold of P < 0.05 whole‐brain family‐wise error corrected.
