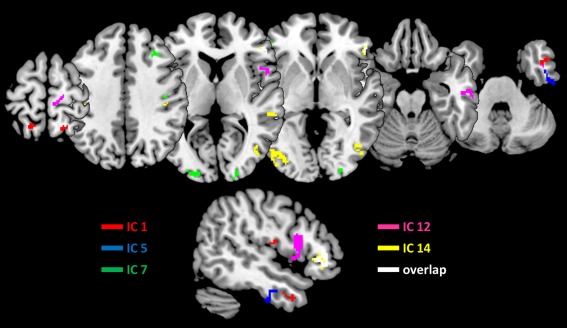
Figure 4.

Source reconstructions for major independent components. Shown are the upper 25% of the MIPs for each of the five components, as well as their overlap. The lower row depicts a sagittal cut through the right inferior frontal region. Interestingly, only IC 12 showed an association with the opercular region, whereas all other components but IC1 at least partially originated from triangular and orbital regions of the inferior frontal cortex. [Color figure can be viewed at http://wileyonlinelibrary.com]
