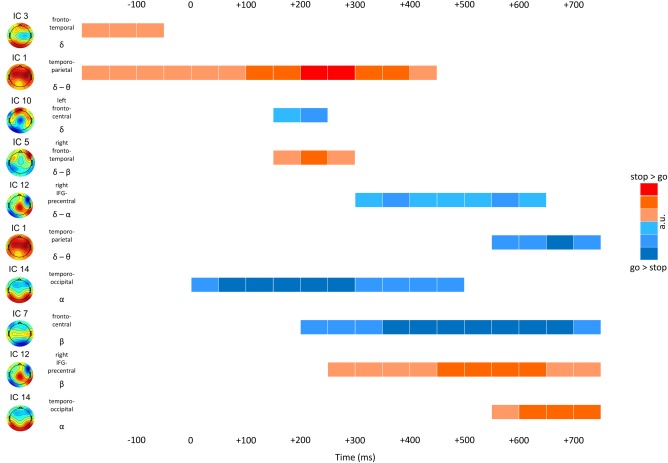
Figure 5.

Schematic of the temporal progression of network activities. Each row corresponds to one of the ten highest ranking features as indicated by the single‐trial classification. Each feature is characterized by its component topography and underlying network, the feature's dominant frequency band, as well as a simplified schematic indicating the direction and strengths of the stop versus go difference. [Color figure can be viewed at http://wileyonlinelibrary.com]
