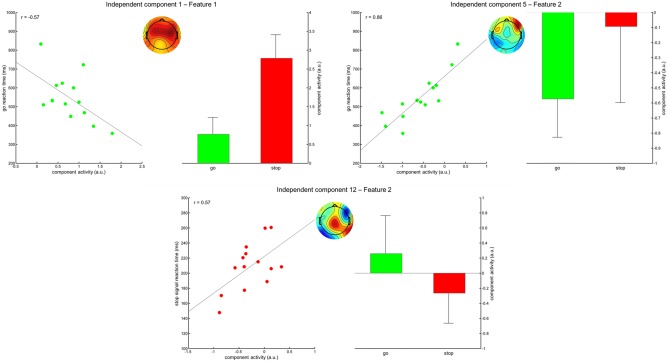
Figure 6.

Correlations of go‐ and stop‐related component activity with go‐RTs and SSRTs. Shown are the correlation plots including regression line and the resulting correlation coefficient. In the middle of each section, the topographic map of the corresponding component is depicted. To the right of each section, the mean activities for the go and stop conditions are shown, including their standard deviations. [Color figure can be viewed at http://wileyonlinelibrary.com]
