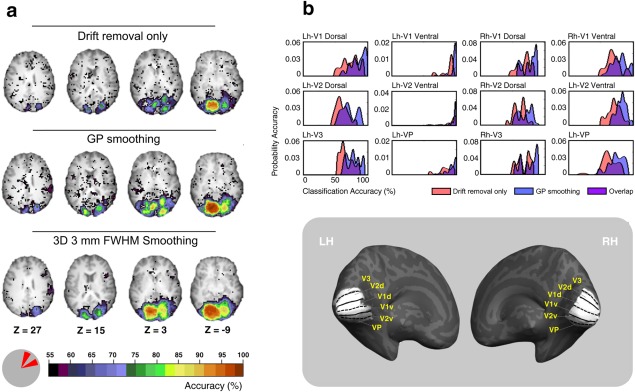
Figure 5.

Comparison of searchlight results for smoothed and unsmoothed data. (a) Shows classification accuracy results of four axial brain slices. The classification was performed between two wedge stimuli presented at two different polar angles within the right upper quadrant shown in the bottom left. The top row results are for data after drift removal only (no smoothing), the middle and bottom rows show results for GP and 3 mm FWHM (3 × 3 × 3 mm Gaussian smoother in volume space) smoothed data, respectively. (b) shows the accuracy distributions for 12 retinotopic dorsal and ventral early visual areas. Pink and blue labels refer to data after drift removal only (no smoothing) and post GP smoothing, respectively. Purple label refers to the overlap zone between the two conditions. The corresponding anatomical locations of these visual areas on an inflated reconstruction of the left (LH) and right (RH) hemisphere of one participant are shown in the bottom right. The cortical surface was defined at the gray–white matter border and was inflated to reveal regions within the sulci (concavities, dark gray) as well as on the gyri (convexities, light gray). [Color figure can be viewed at http://wileyonlinelibrary.com]
