
Figure 9.
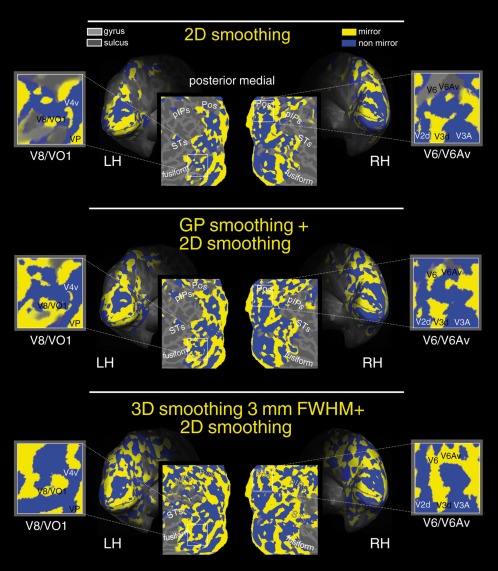
Maps of retinotopic field sign in occipital areas. Analysis of retinotopic data (polar angle and eccentricity) by visual field sign (mirror‐image versus nonmirror‐image visual field representation) [Sereno et al., 1995]. Mirror‐image areas (yellow; e.g., V1), and nonmirror‐image areas (blue; e.g., V2) are shown in the left (LH) and (RH) inflated and flattened hemispheres of one participant. This figure shows field sign maps obtained using different smoothing: 2D surface smoothing only (top), 2D surface smoothing combined with GP smoothing (middle), 2D surface smoothing combined with the traditional volumetric 3D smoothing (bottom). The same significance threshold was used for all maps. Other labels as in Figure 6. [Color figure can be viewed at http://wileyonlinelibrary.com]