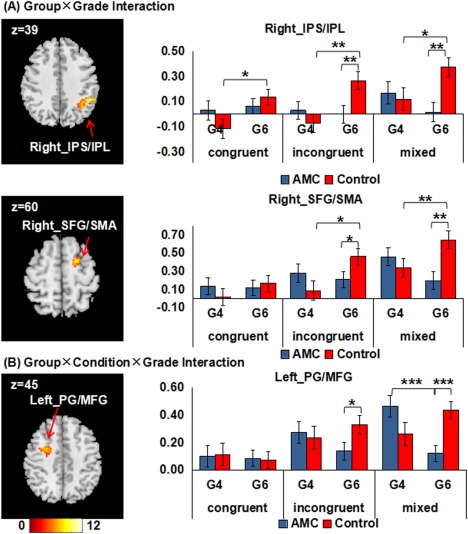
Figure 4.

Clusters surviving in the factorial ANOVA. (A) Two clusters that are significant for the Group × Grade interaction effect. (B) One cluster that is significant for the Group × Condition × Grade interaction effect. All images are thresholded at p < 0.05 using Alphasim correction. The left side of the axial slices corresponds to the left side of the brain. The histograms show mean beta value extracted from each cluster. Error bars indicate one standard error of the mean. IPS, intraparietal sulcus; IPL, inferior parietal lobule; SFG, superior frontal gyrus; SMA, supplementary motor area; PG, precentral gyrus; MFG, middle frontal gyrus; G4, 4th grade; G6, 6th grade; * p Bonferroni corrected < 0.05; ** p Bonferroni corrected < 0.01; *** p Bonferroni corrected < 0.001. [Color figure can be viewed at http://wileyonlinelibrary.com]
