
Figure 5.
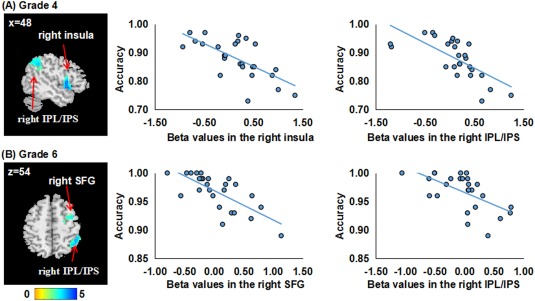
Brain‐behavior correlations in the AMC group. In each row, the left panel displays significant clusters in the AMC group, where higher accuracy is associated with lower brain activity. All images are thresholded at p < 0.05 using Alphasim correction. The left sides of the axial slices correspond to the left side of the brain. The right panel displays scatter distributions between mean beta values extracted from each cluster and accuracy in the mixed condition. IPS, intraparietal sulcus; IPL, inferior parietal lobule; SFG, superior frontal gyrus. [Color figure can be viewed at http://wileyonlinelibrary.com]