
Figure 6.
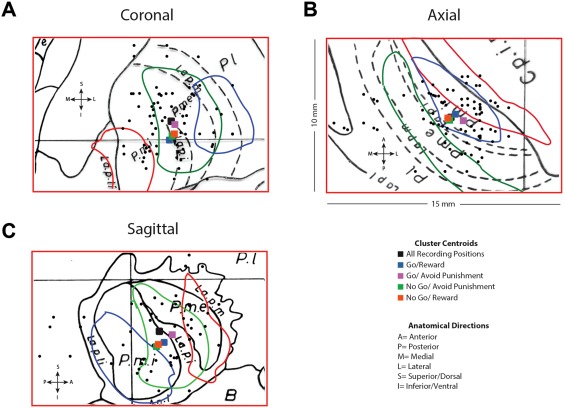
Positions of Recorded GPi Neurons. The spatial location of the microelectrode recording sites in GPi as transposed onto the Schaltenbrand–Bailey atlas. (a) The GPi from coronal slices F.a 7.5 (drawn in red), F.a 3.0 (drawn in green), and F.a 2.0 (drawn in blue) are superimposed on F.p 5.0 (drawn in black). (b) The GPi from axial slices H.v −1.5 (drawn in red), H.v −3.5 (drawn in green), and H.v −6.0 (drawn in blue) are superimposed on H.v −4.5 (drawn in black). (c) The GPi from sagittal slices S.l 16 (drawn in red), S.l 18.5 (drawn in green), and S.l 21.5 (drawn in blue) are superimposed on S.l 20 (drawn in black). The portion of each slice shown is 10 mm by 15 mm. Black dots represent recording positions. Colored squares represent the centroid of clusters of neurons responsive to feedback in each of the conditions.