
Figure 1.
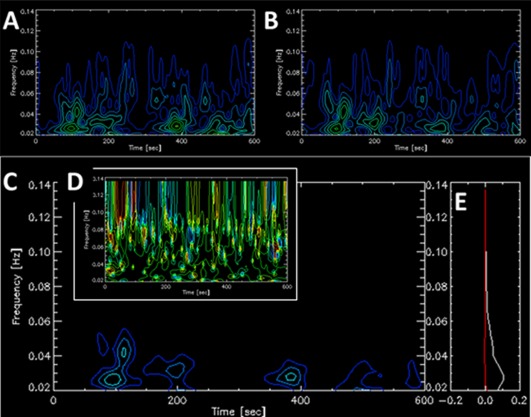
Wavelet time‐frequency contour plots of two cortical regions and the functional connectivity (FC) between them for a single subject. (A) Amplitude wavelet presentation of left precentral gyrus. (B) Amplitude wavelet presentation of right precentral gyrus. (C) Time‐frequency plot of the amplitude values of FC [Eq. (4)] describing the coherence between A and B. (D) Time‐frequency plot of the phase values of the FC in C. (E) Real (in white) and imaginary (in red) components of the FC averged over time with the y‐axis indicating the intensity [Eq. (5)]. The complex FC value averged over time and frequency was (0.93,0.0) and the Pearson's correlation coefficient was 0.90. [Color figure can be viewed at http://wileyonlinelibrary.com]