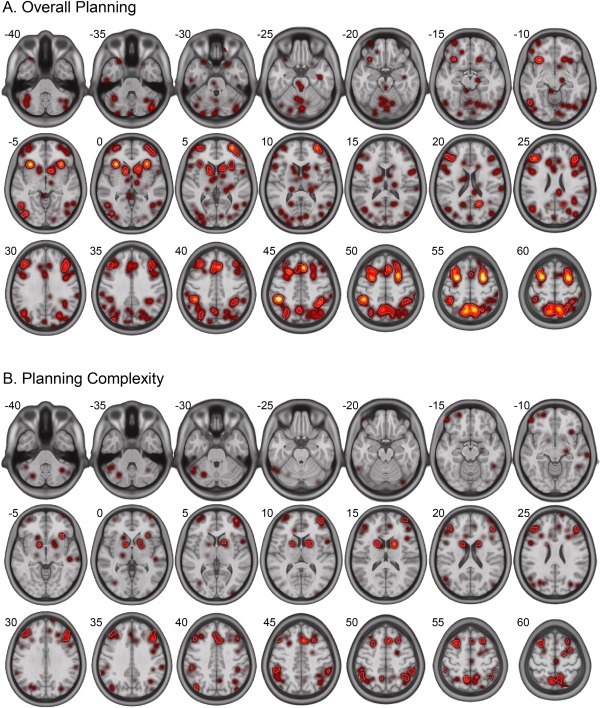
Figure 4.

Spatial distribution of resulting activation patterns for the ALE meta‐analyses on (A) Overall Planning and (B) Planning Complexity. White contours reflect the applied FDR threshold of P < 0.01. Numbers besides the axial slices refer to z‐coordinates in MNI‐space.
